Climate
Impact on society and Vion's role
Food production contributes to greenhouse gas emissions, primarily methane, nitrous oxide, and carbon dioxide. Our contribution to global warming is estimated at less than 5% of supply chain emissions, mainly due to animal feed production and farm methane emissions. At the same time, soil and vegetation on farms help to remove carbon from the atmosphere; this in turn has a positive impact on the climate. We make our carbon footprint transparent to provide our supply chain partners with insights into current emission levels and to show how these compare to other food products. This will stimulate the whole supply chain to make more sustainable choices to reduce the CO2 footprint. In this way, we work towards the sustainable management and efficient use of natural resources.
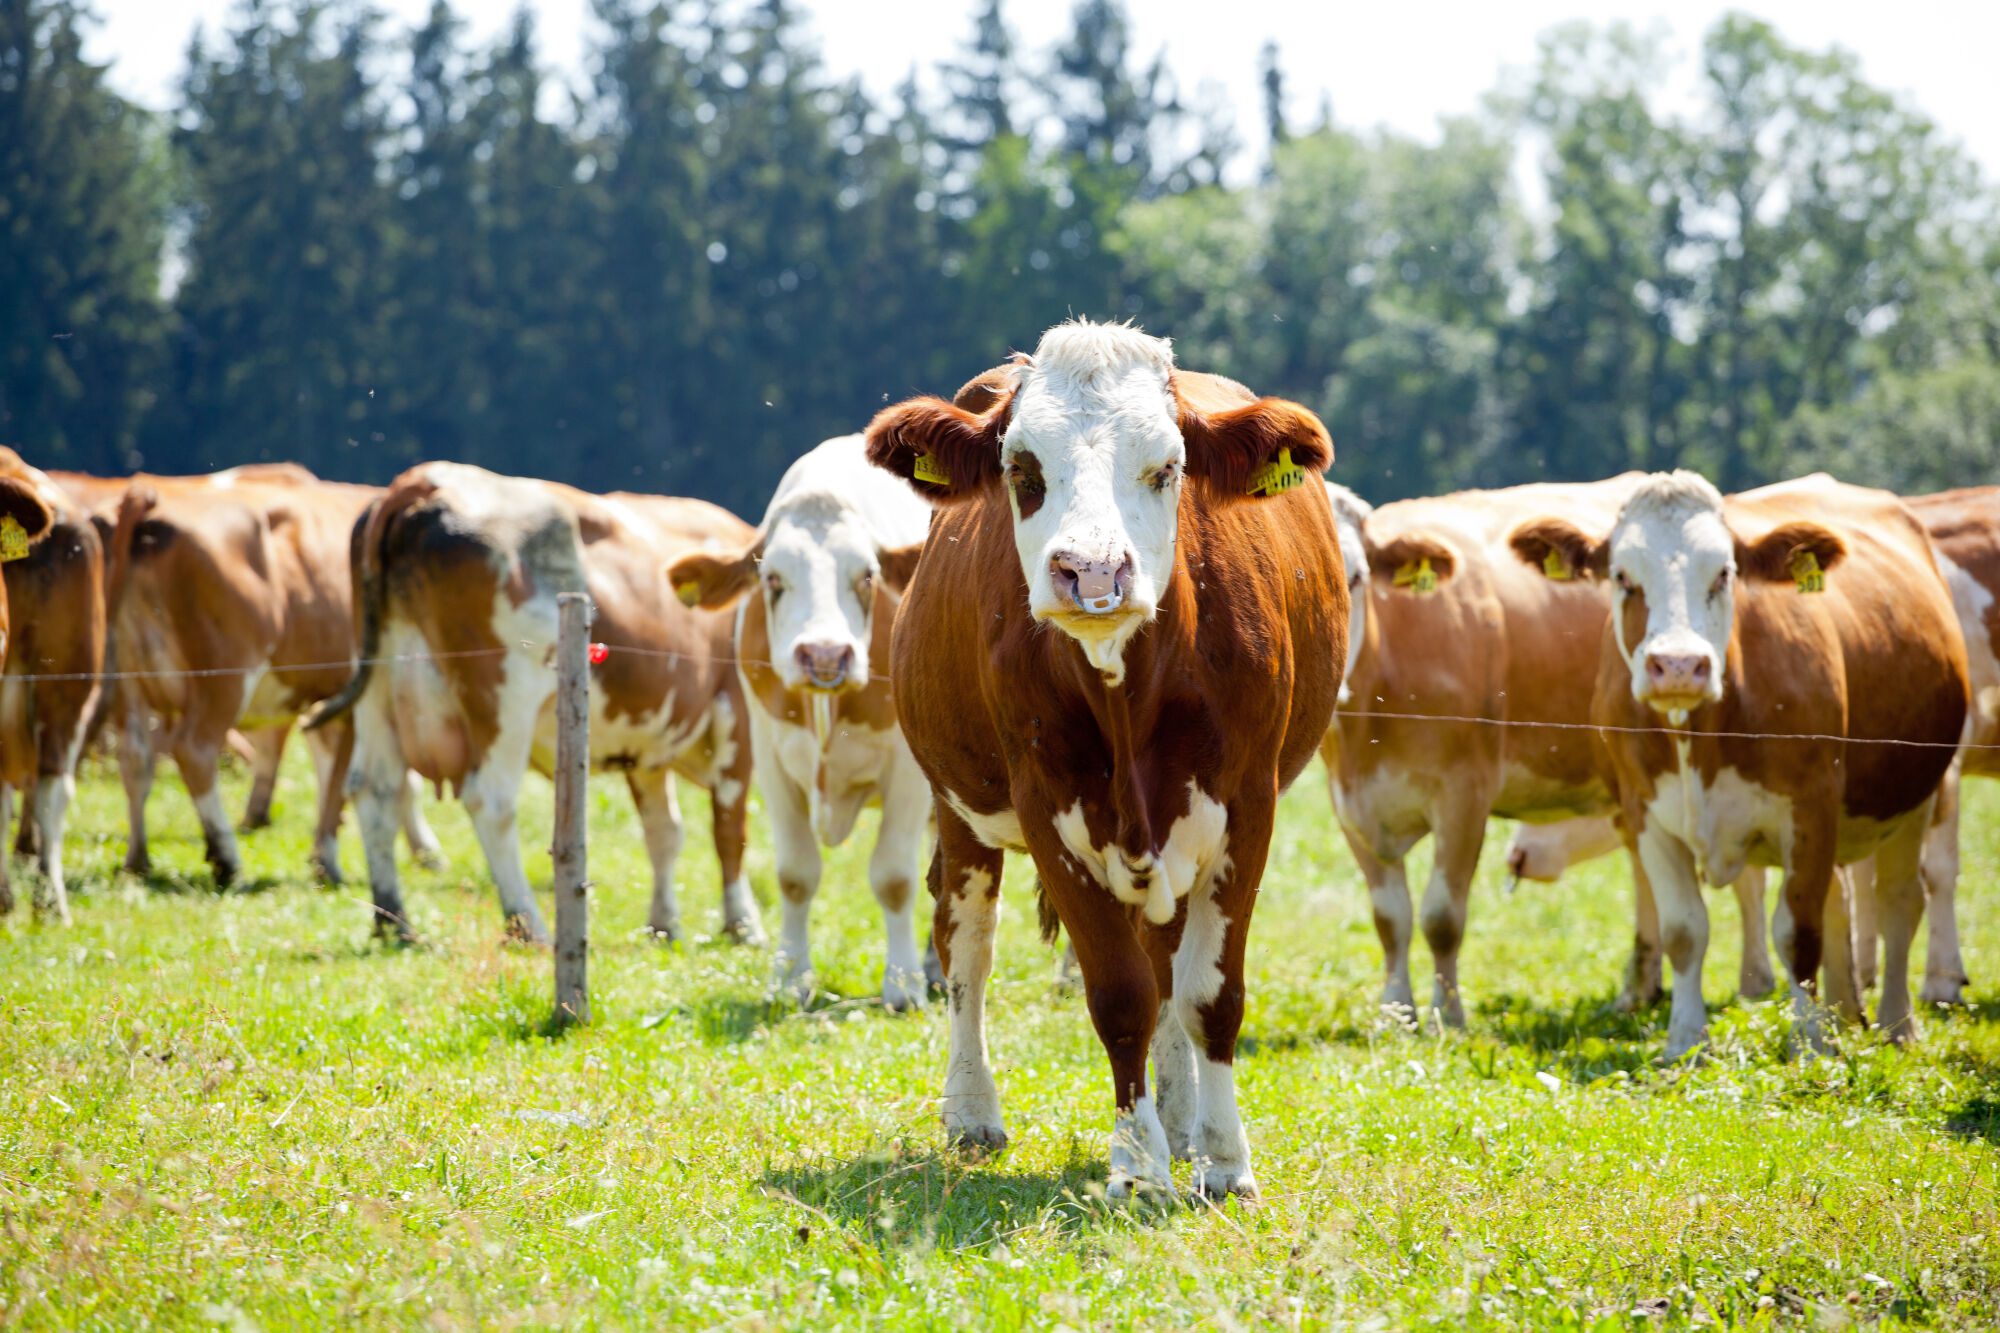
We are committed to bringing to market food products that have a lower carbon footprint than those available today, and to provide information to customers and consumers on the footprints of the products they buy. During the past five years, Vion has carried out several studies to define the actual carbon footprint of the products we produce and market. This was done as part of our research activities with several stakeholders and based on international guidelines and scientific information.
Our carbon footprint ambitions are based on what we have learned over recent years about our own performance. Those ambitions are further aimed at reducing our emissions to a level that limits global warming to <1.5°C. These ambitions are in line with governmental rules such as the Paris agreement and the European Green Deal. Vion committed to the Science Based Targets initiative (SBTi), an independent organisation for setting science-based targets for our carbon footprint (scopes 1, 2 and 3) to ensure that our reduction ambitions are in line to limit global warmings of 1,5 degrees Celcius.
Our CO2e targets between 2021 and 2030 are at least 42% absolute reduction for scopes 1, 2, and 3 non-FLAG (forest, land and agriculture) emissions and 30.3% for scope 3 FLAG emissions.
Approximately 40% of the electricity we use is used to cool meat and so ensure the quality and safety of our products. We evaluate our energy contracts with the aim of reducing costs and securing a continuous supply. At the moment, we are increasing the share of renewable energy in our standard contracts. In parallel, we are reviewing our overall energy purchase strategy to achieve our 100% green electricity target by 2030 (scope 2). One alternative is setting up long-term Power Purchase Agreement (PPAs) with renewable sources, not only to use green electricity, but also to foster the development of such projects.
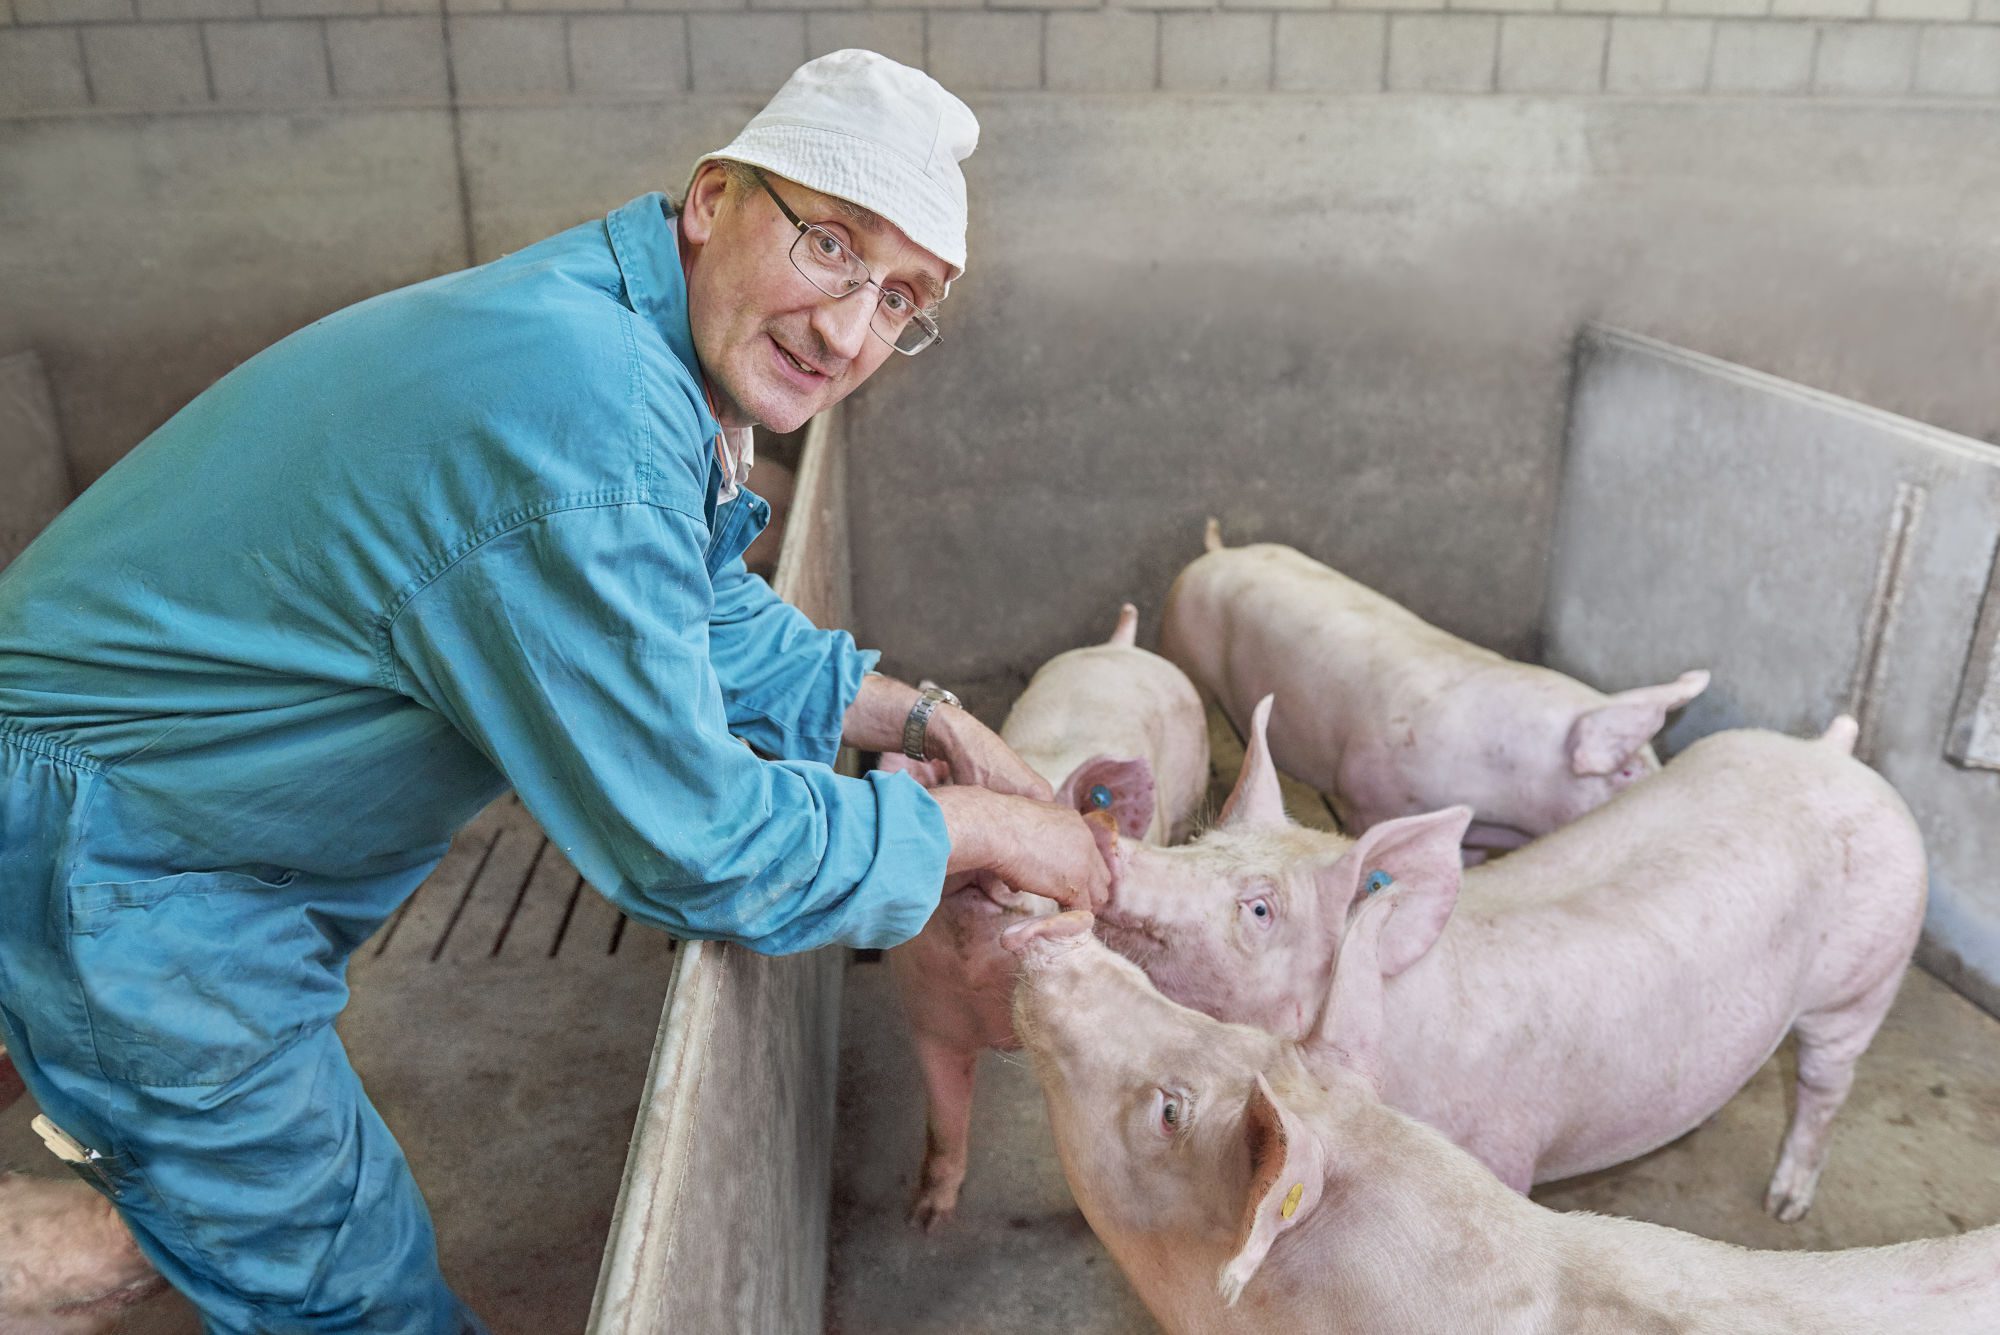
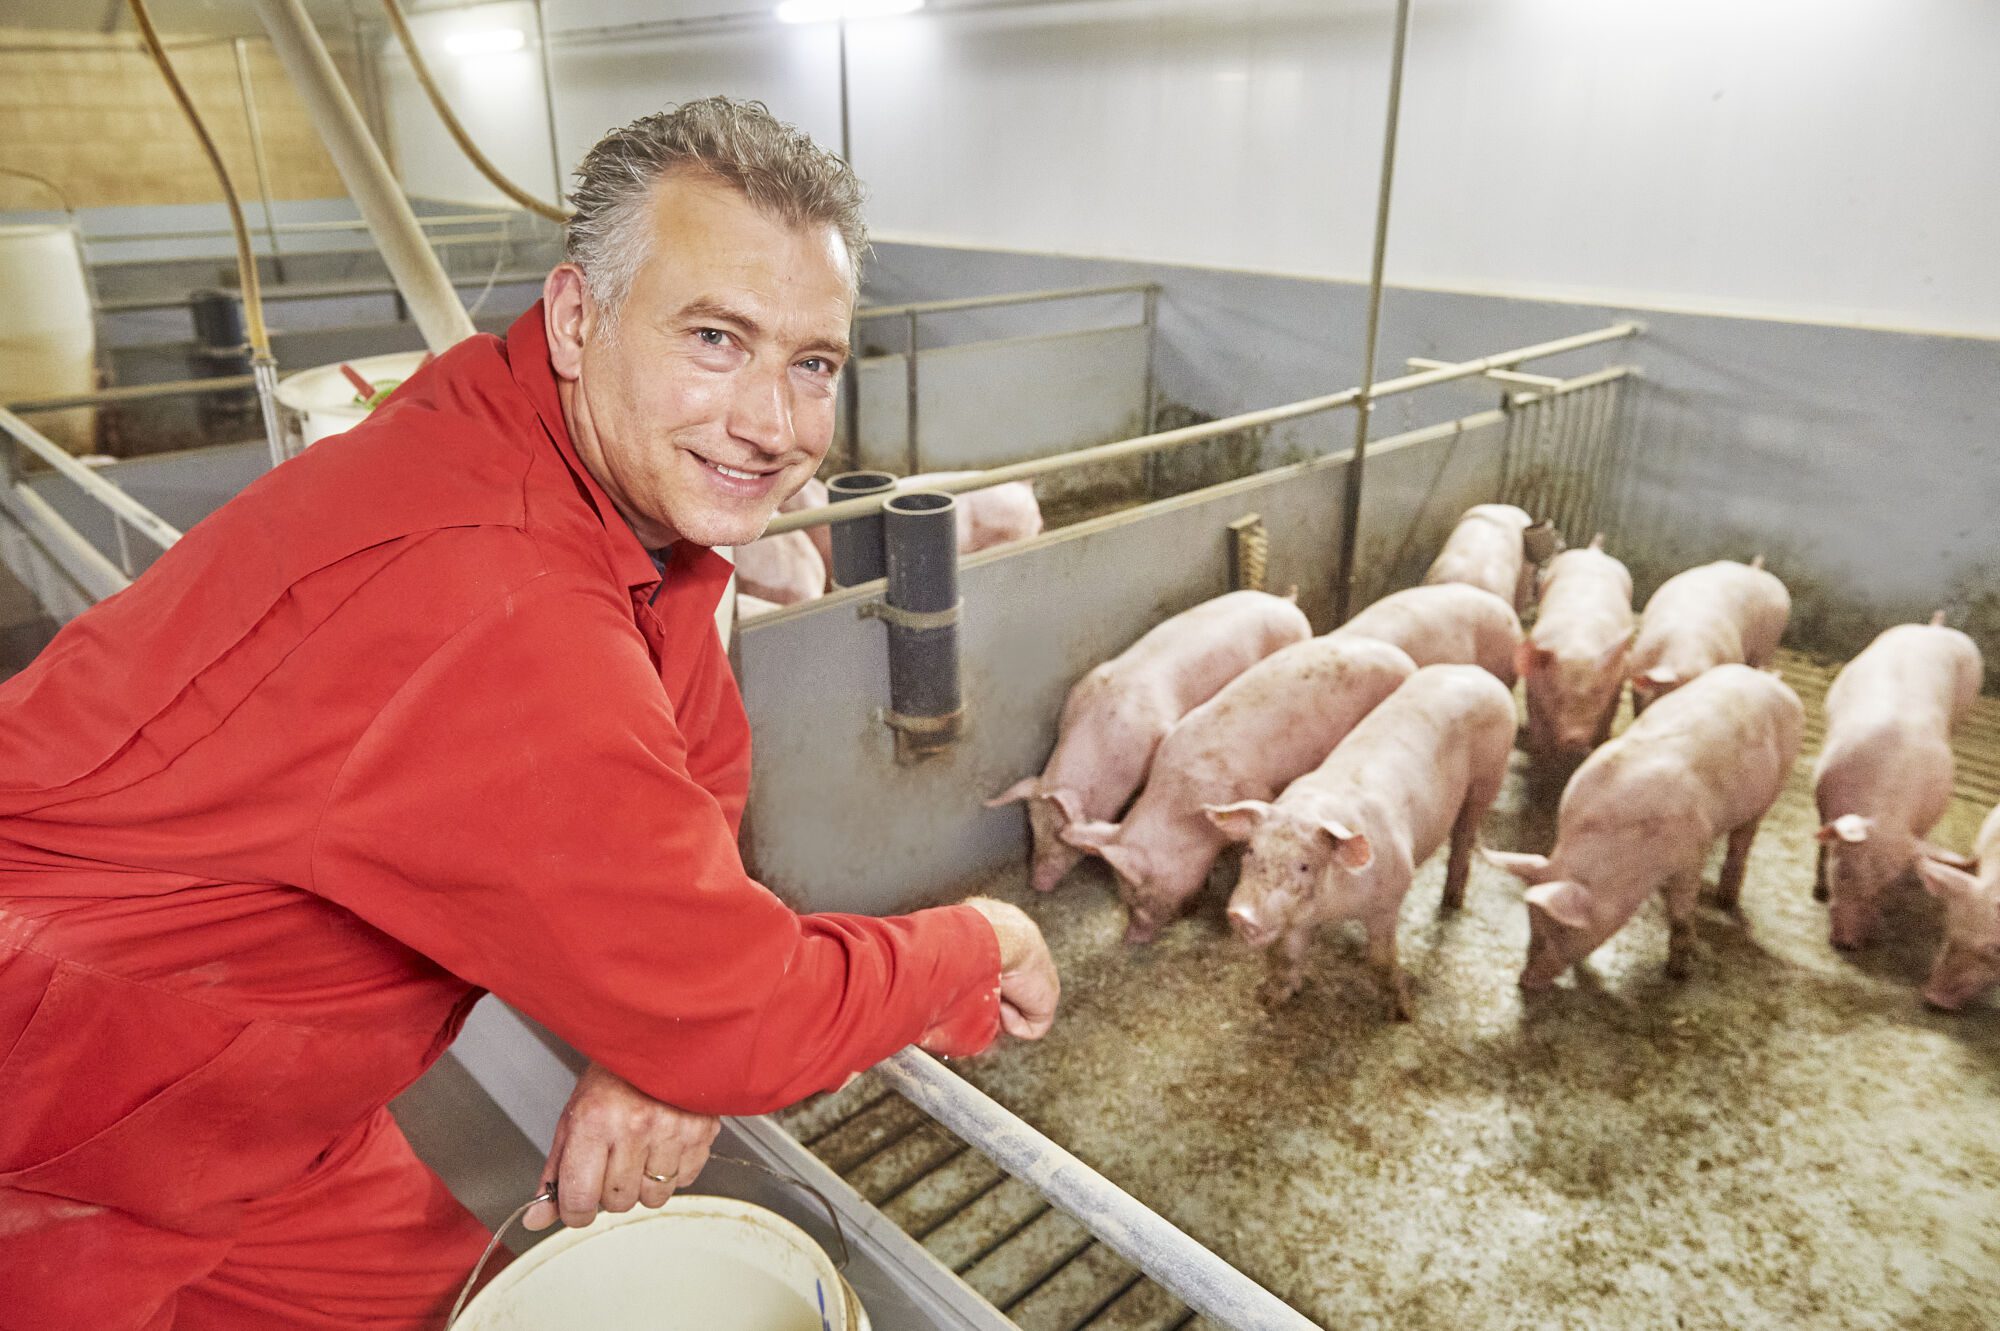
The carbon footprint of pig farming is mainly composed of the production of feed and on-farm manure storage and processing. Our initial calculations show a substantial variation between farms. If we succeed in eliminating half the variation between farms, we could reduce the carbon footprint by at least 10%.
The regional pig diet is largely composed of by-products from the food industry. The lower footprint of these products makes them relevant to the control of the carbon footprint of pig production. All pig and cattle farmers can access these carbon-emission-friendly sources of feed ingredients. Science and technology can also help farms to increase the nutritional value of feed and thereby reduce the carbon footprint of pork.
Several projects are currently running to reduce the carbon and methane emissions of manure collection, storage and processing. Doing this will reduce emissions substantially from 2025, which is when the results will become available.
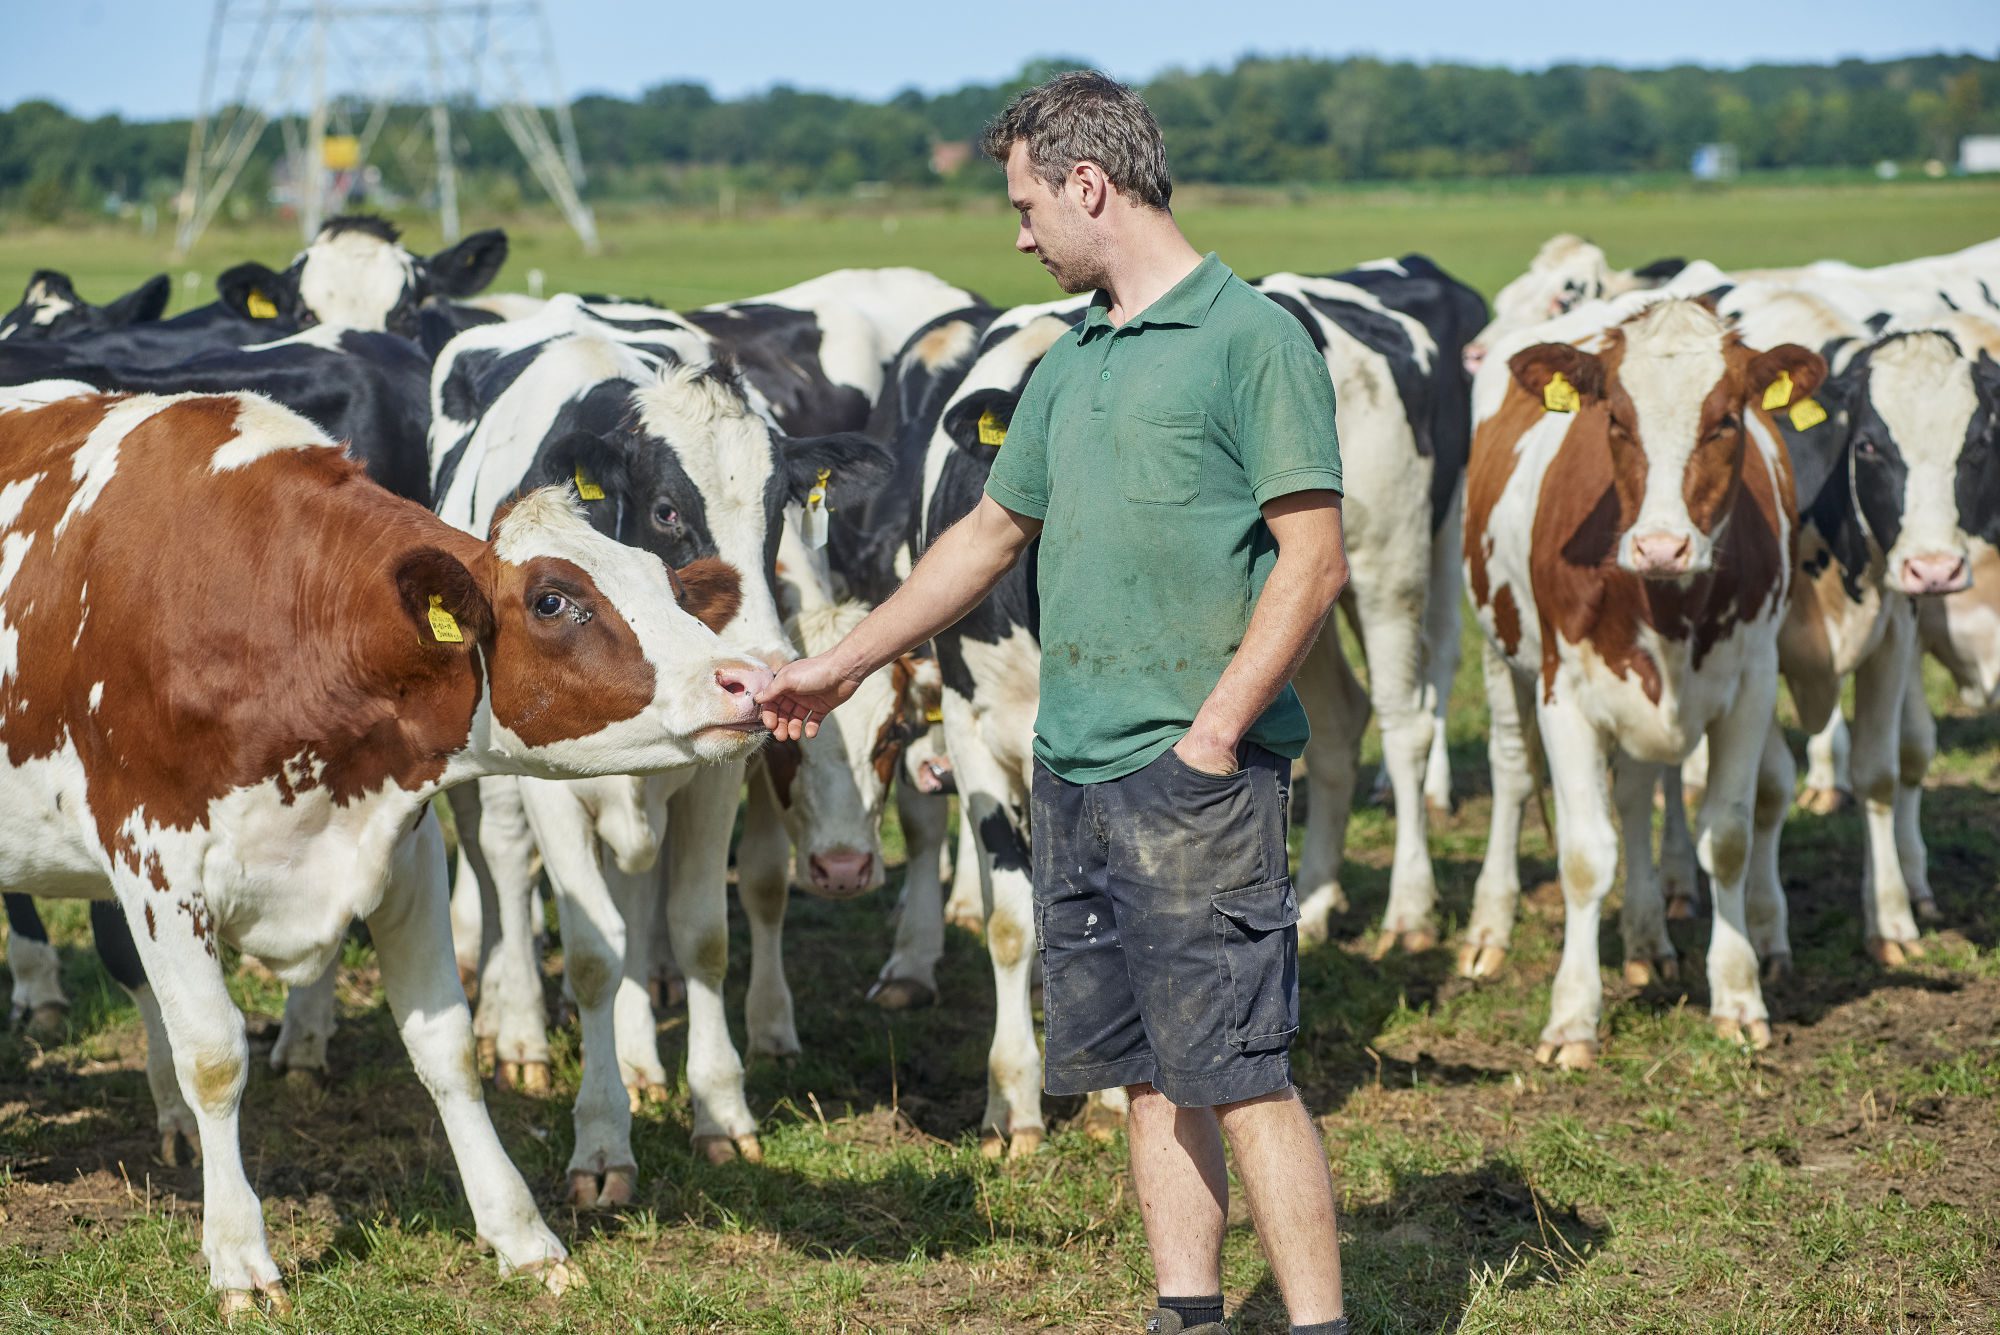
The potential pace of carbon footprint reduction is slightly faster in pig farming than in cattle farming. Among other reasons, this is the result of the complex, counteracting mechanisms in the rumen system of cattle, with its substantial production of methane. Methane emissions from rumination and manure can cause substantial greenhouse gas emissions. However, Vion mainly slaughters dairy cattle and the offspring of dairy cattle, which are essentially by-products of dairy production, making the CO2 footprint substantially lower than that of beef from pure meat breeds.
We are developing programmes to reduce methane and manure emissions significantlyand so achieve sustainable production. We expect that, from 2025, this can fuel a faster rate of carbon footprint reduction at cattle farms. We also expect that cattle farmers will have opportunities to increase and measure carbon sequestration in the near future.
Regarding the purchase of animal products from slaughterhouses elsewhere, we will further increase the pressure on our suppliers to gradually reduce the carbon footprint of their products in the coming years. The suppliers of food constituents need a few more years to do this than, for example, the suppliers of packaging materials and other products. Also, our meat suppliers must await the adaptation process at farm and feed level. We therefore differentiate the pace of carbon reduction according to the possibilities available in the different supply chains.
We are developing programmes to reduce methane and manure emissions significantlyand so achieve sustainable production.
News & Stories
Activities in 2022
We created a central energy team so we could focus on creating the environment required to achieve our targets. We recruited a CSR Portfolio Manager who will coordinate and report on scopes 1,2 and 3. We recruited people to accelerate our carbon footprint calculations with our farmers and completed the first calculations for cattle in the Netherlands and Germany. We spent over € 4 million in energy projects to reduce our energy consumption by 8 GWh per year, and contacted suppliers in our value chain for actual data to make our calculations more accurate. We addressed stakeholder groups to help us address potential negative impacts of our activities on the climate, and how to mitigate them. We are creating specialised teams in the company to work on climate impact reduction. We have prioritised a list of climate impact measures aimed at reducing our impact and a planning when these measures will be achieved.
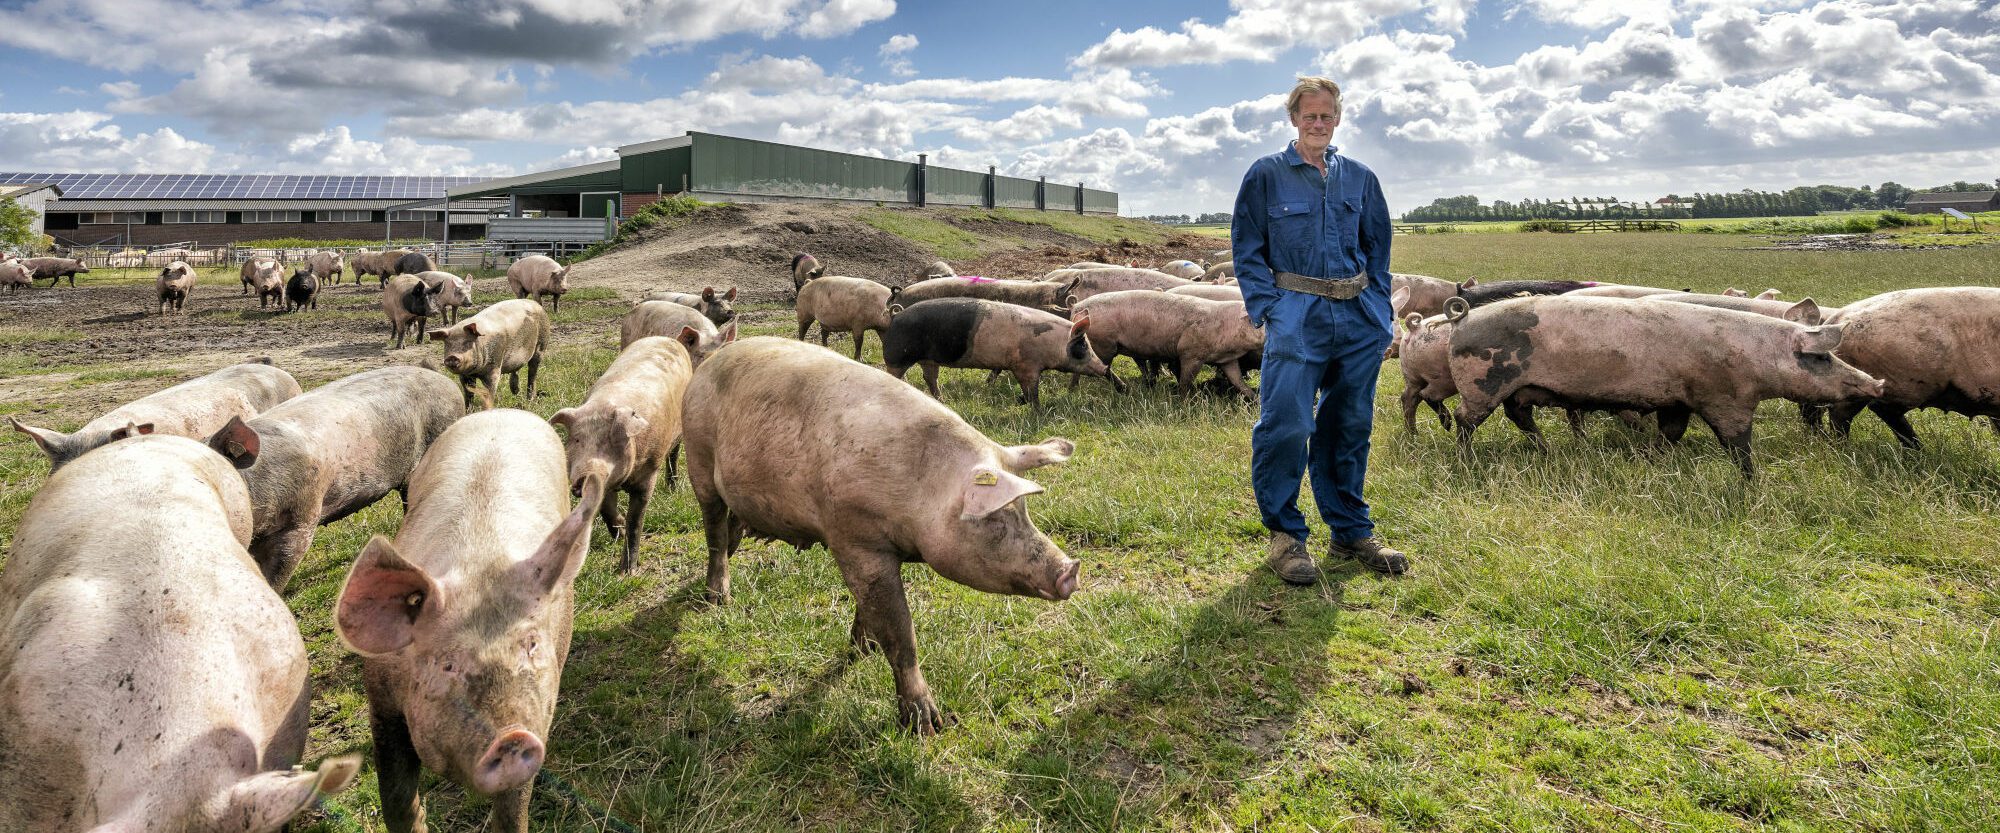
In Germany, we hold ISO 50001 certification at all our plants, ensuring the efficiency and lower energy consumption of our sites. We want to expand this certification to a larger number of sites beyond Germany. In 2022, the central energy team developed an energy management system for the Netherlands and Belgium, and started to roll out the system in Groenlo, the Netherlands. This energy management system will be implemented in all our other Dutch plants as well. ECON, our electricity and gas measurement system, is installed in 95% of our sites in Germany and 33% in the Netherlands. We expect to reach 100% in both countries by the beginning of 2023.
As cooling represents the biggest part of our electricity usage, we are focusing on ways to make the process more energy efficient.In addition to the spray cooling system used to cool carcasses and a programme to optimise the cooling temperature per room and per moment, we are investing in modernising our cooling system at approximately 10 sites. In Perleberg and Emstek, we modernised the cooling system in order to cut the amount of energy consumed. We also invested in modernising our cooling systems at our locations in Altenburg and Buchloe.
Vion’s cooling systems use ammonia and CO2. Some, however, also use Freon. The use of Freon is being replaced by ammonia or CO2 as cooling installations are renewed. Doing this lowers greenhouse gas emissions as Freon has a significantglobal warming potential. Ammonia does not contribute to ozone depletion or global warming, and it also has very good physical and thermodynamic properties. CO2, however, is a more economical refrigerant and safer for our workers. We look for the best solution for each situation.
We are always looking for ways to re-use released energy. In 2021, we began evaluating the idea of converting slaughterhouse waste into power, to ensure long-term, profitable independent energy. This evaluation has demonstrated potential in various areas, including biogas generation, heat recovery, by-product usage and others. Our goal now is to extract as much energy as possible from these sources to reduce and re-use what was previously wasted.
One example in 2022 was the installation of a heat recovery system in Crailsheim, Germany, on the chimneys of the pork line. This enables us to recover energy that was previously wasted. We use it to heat water for cleaning and so reduce our gas consumption. Other similar projects are planned for 2023, and our goal is to replicate successful projects in as many sites as possible.
In Enschede, the Netherlands, we installed a heat pump that uses the heat from the machine room to produce warm water for the offices and changing rooms. Doing so has completely replaced the use of gas for this. Reducing our gas dependency is another positive effect of such projects.
In 2022, Buchloe and Crailsheim, in Germany, installed solar panels on the roofs of the cleaning areas for the live animal trucks. These will produce 240 MWh of electricity a year. The newly acquired Distrifresh cold storage facility, in Den Bosch, the Netherlands, already has a solar panel installation on the roof. This produces 120 MWh of electricity per year.
Vion’s central logistics team works continuously on projects that will lower our carbon footprint. One goal is to reduce transport distances and so emissions, in combination with the central packaging pooling project.
We continually renew our fleetwith more efficient trucks. We added eight electric trailers at the Vion Move subsidiary in Twist, Germany, in 2022. We also added 15 new eco-trailers at Distrifresh Boxtel and three electrical terminal tractors. These trailers are zero-emission for fossil fuels (Scope 1). In mid-2022, we expanded Distrifresh Boxtel by adding a new cold storage location in Den Bosch, the Netherlands. This reduces travel distances and optimises processes.
Digitalisation is one of the key factors in achieving carbon footprint reduction. We are therefore working on the following projects:
- Extension of the central Transport Management System
- Transparency
- Trustworthy data
- Route optimisation
- Avoiding driving empty
- Synergising Vion-owned transport companies to reduce empty mileage
- Better utilisation of Vion-owned fleets(with third parties)
- Start digitalising transport related documents (E-cmr)
- Mid to long-term agreements with suppliers to use ecological logistic solutions
Working closely with our central logistics team, Salomon FoodWorld and FVZ Convenience developed an optimised logistics plan to reduce CO2-emissions by 25%. This plan received the Lean & Green Award. Our next step is to evaluate hydrogen-powered vehicles and their potential for use in logistics.
As cooling represents the biggest part of our electricity usage, we are focusing on ways to make the process more energy efficient
News & Stories



Clarification of the results
Vion took significant steps to increase the calculation of emissions from farms and to reduce the gap between the number of pig and cattle farmers
being assessed. Our focus in 2022 was to achieve transparency, and this effort will continue in the coming years until we have enough data to calculate our CO2 footprint. The use of primary data (the real footprint) showed to be very helpful for farmers to understandthe opportunities and challenges that exist to reduce the carbon footprint.
Our target for 2022 was to calculate emissions of 160 pig farms. At publication date we have calculated the results of more than 160 pig farms. Our target for 2023 is to have calculated the results of 250 pig farms.
News & stories
BOXTEL – In April 2023, Vion submitted climate targets to the Science Based Targets initiative for review, to show we take out responsibility in limiting global warming to below 1.5oC. The target setting followed a full quantification of out Scope 1 and 2, and a full screening of all Scope 3 categories. In this screening, the organizational boundaries of Vion were set based on financial control, to align greenhouse gas emission reporting with our financial reporting.
Scope 1
Figure 1 shows our total Scope 1 emissions for three consecutive years. In the calculations, these emissions are broken down into the components ‘own generation of electricity, heating, cooling and steam (stationary combustion)’, ‘transportation (mobile combustion)’ and ‘fugitive emissions’. Concrete emission sources taken into account are:
- Gas and fuel consumption
- Vion’s transportation of workers, animals and products
- Refrigerants for refrigeration and air conditioning
- Methane emissions of the animal while at Vion
- Use of CO2 for packaging and to anesthetise pigs
Scope 2
Figure 1 also shows our total Scope 2 emissions for three consecutive years. Emissions considered in our Scope 2 calculations include:
- Purchased electricity consumption
- Purchased heat consumption
Our Scope 2 greenhouse gas emissions are calculated according to both the location-based and market-based method (see Table 1).
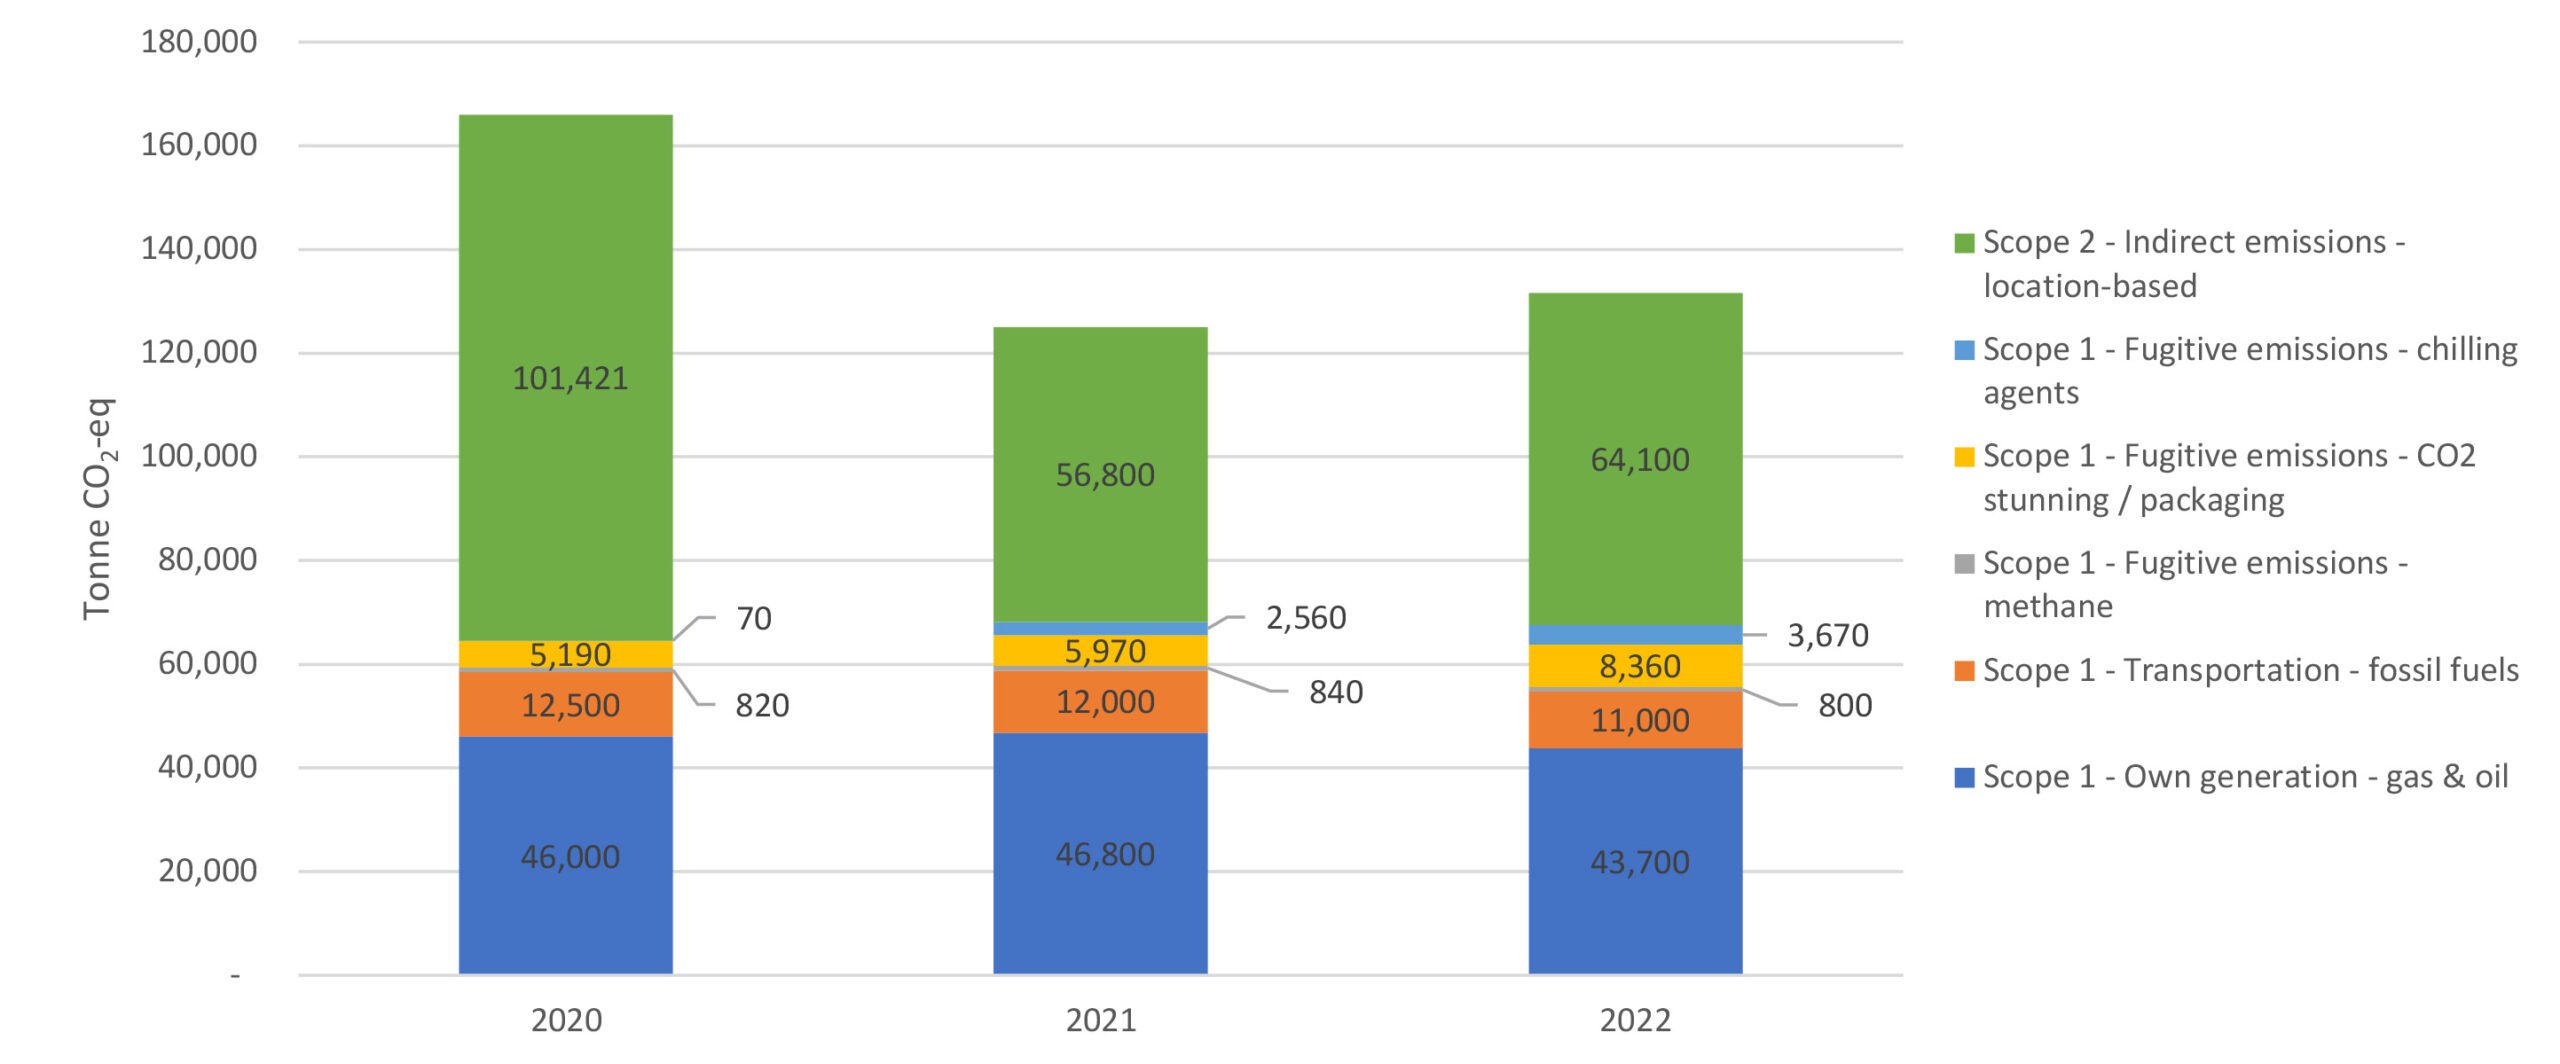
Figure 1: Vion’s annual Scope 1 and 2 emissions broken down into different emisson sources
| Reference year: 2021 | Most recent year: 2022 | |
|---|---|---|
| Scope 1 | 64,400 | 64,100 |
| Scope 2 location based | 56,800 | 73,400 |
| Scope 2 market based | 60,900 | 58,600 |
Scope 3
By far the greatest emissions attributed to Vion occur upstream in the supply chain, associated with the animal production systems and associated infrastructure. In the SBTi and Greenhouse protocol, reporting on the emissions from the agricultural/land sector are specifically described. We therefore also split the description of the Scope 3 emissions into the emissions associated with the live animals (Forrest, Land-use and Agriculture (FLAG)) and emissions associated with the other Scope 3 categories (non-FLAG).
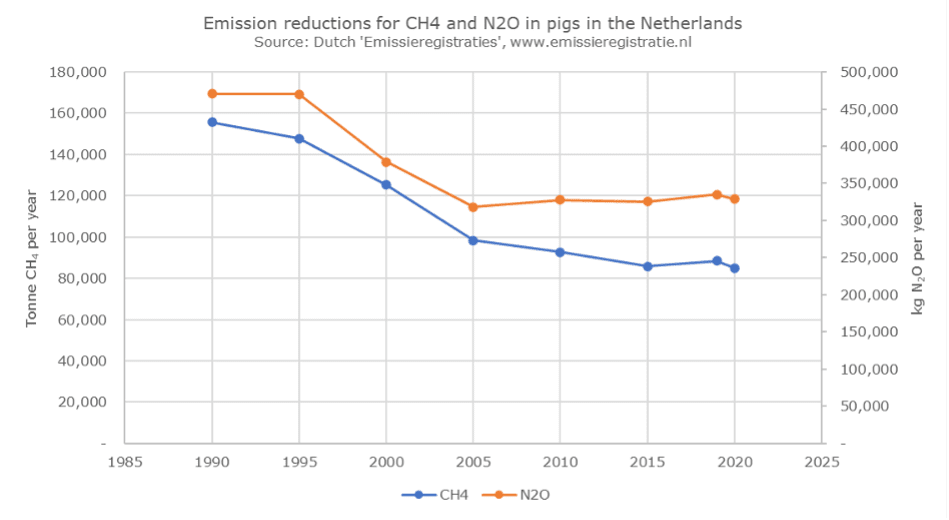
Figure 2: reduction in methane and dinitrousoxide emissions in the Dutch pig population between 1990 and 2020 (source: https://data-preview.emissieregistratie.nl/emissies/grafiek?s=u5pCEfSri)
Category 1 ‘Live animals’
The national climate agreement in the Netherlands and the Paris-agreement defined the baseline year for reductions at 1990. The specific values for these years for specifically the supply chain in which Vion operates were unknown. An impression of the reductions that have been achieved in the supply chains so far can be obtained from the Dutch emission registration board. The methane and dinitrousoxide emissions from 1990 to 2020 for the pig population showed a >50% decrease for both greenhouse gasses (Figure 2). Reductions are a result of sustainability efforts ongoing also in the supply chain of Vion, with amongst others implementation of low-emission stables, increased use of byproducts from the food industry and feed-efficiency improvements.
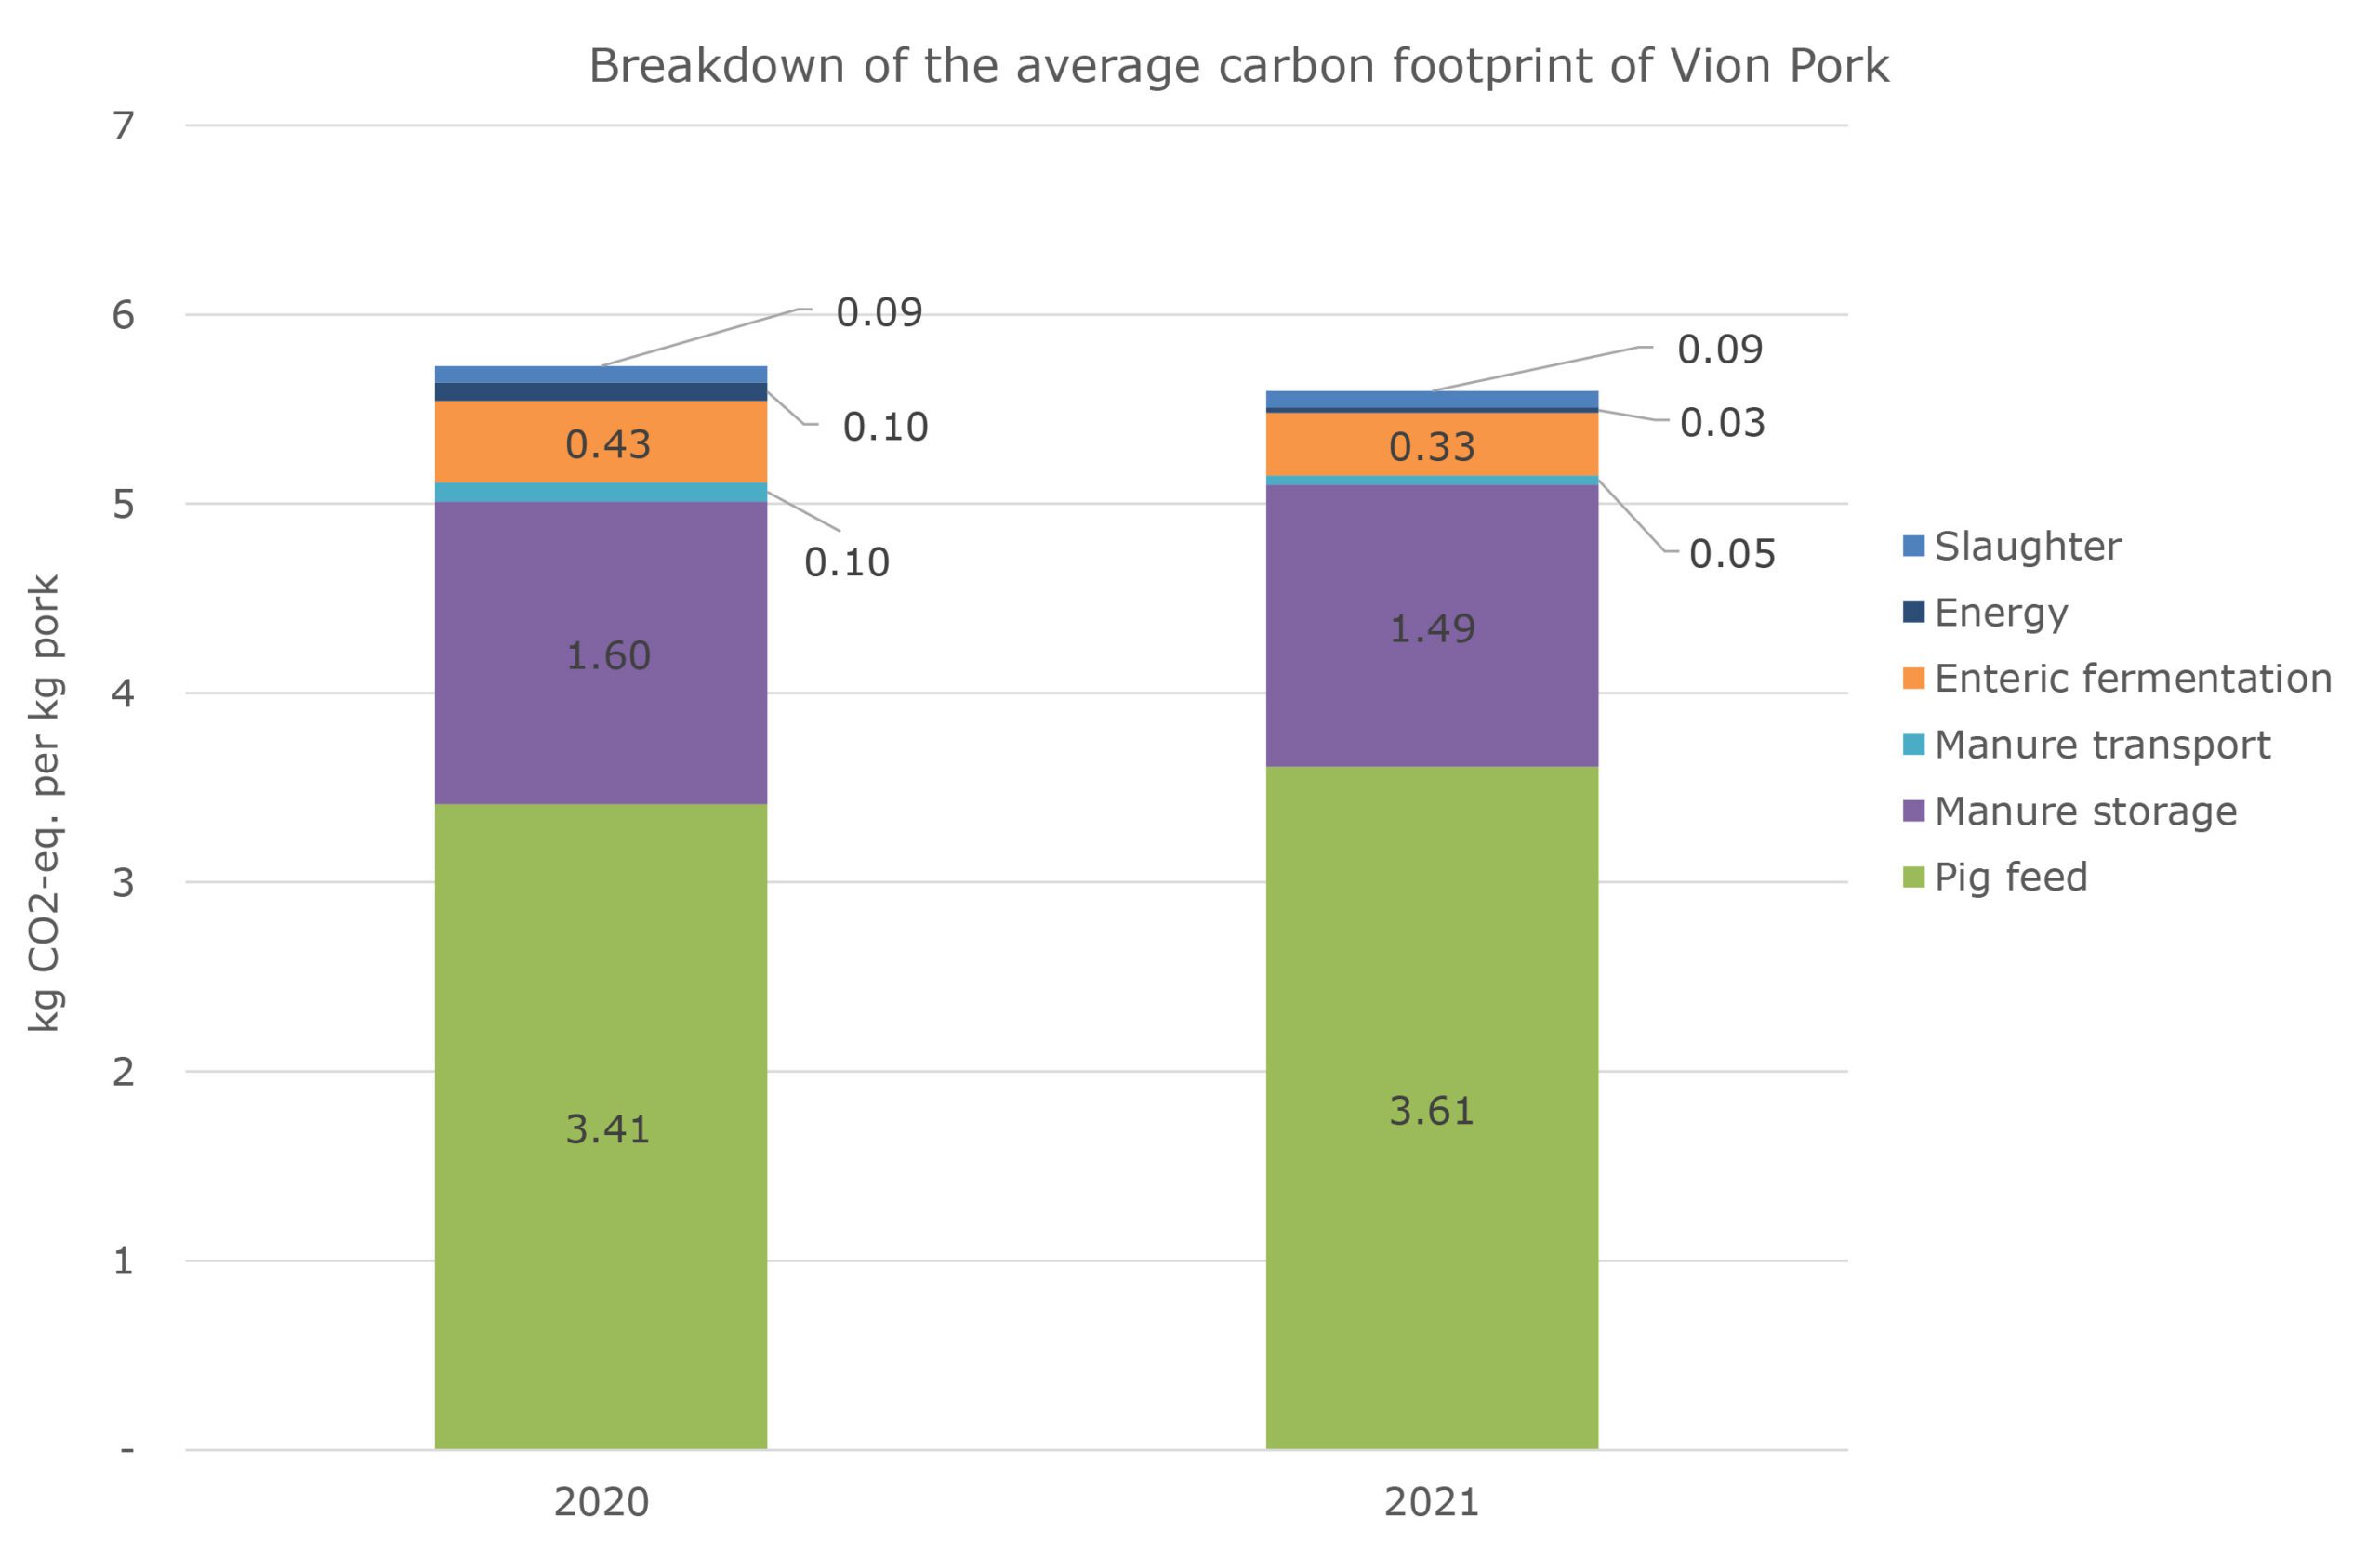
To quantify the carbon footprint of our pork production, we worked together with Wageningen University to identify the LCA-model to use for calculating the carbon footprint of pork (published as https://edepot.wur.nl/514323). This model is based on the Product Environmental Footprint (PEF) standard by the European Commission and builds on existing PEFcr’s for relevant parts of the supply chain, such as on the PEFcr for animal feed and the PEFcr for dairy cattle beef. Calculations are done based on primary data collected at the source through the data cooperation JoinData. This means that quantities and origin of feed raw material are obtained directly from feed suppliers, transport data directly from government databases (RVO) and specific farm data from the farmers through a dedicated online portal. Figure 3 shows the calculated carbon footprint for pork production, based on these data.
Figure 3: average buildup of the carbon footprint of Vion Pork
For dairy beef, the approach towards quantification is developed and implemented by the Dutch Dairy industry, in cooperation with Wageningen University and Blonk consulting. For this implementation the software tool called ‘Annual Nutrient Cycle’ (in Dutch ‘Kringloopwijzer’) was used. Similar to our calculations for pork, the beef-calculations are based on the European PEF-guidelines. More specifically: the PEFcr for dairy and the PEFcr for feed form the basis of the software. Vion can make use of these data when the farmer provides us with the appropriate authorisation. Figure 4 shows the calculated carbon footprint for beef production, based on these data.
Figure 4: Average buildup and reduction in the carbon footprint of Dutch dairy beef
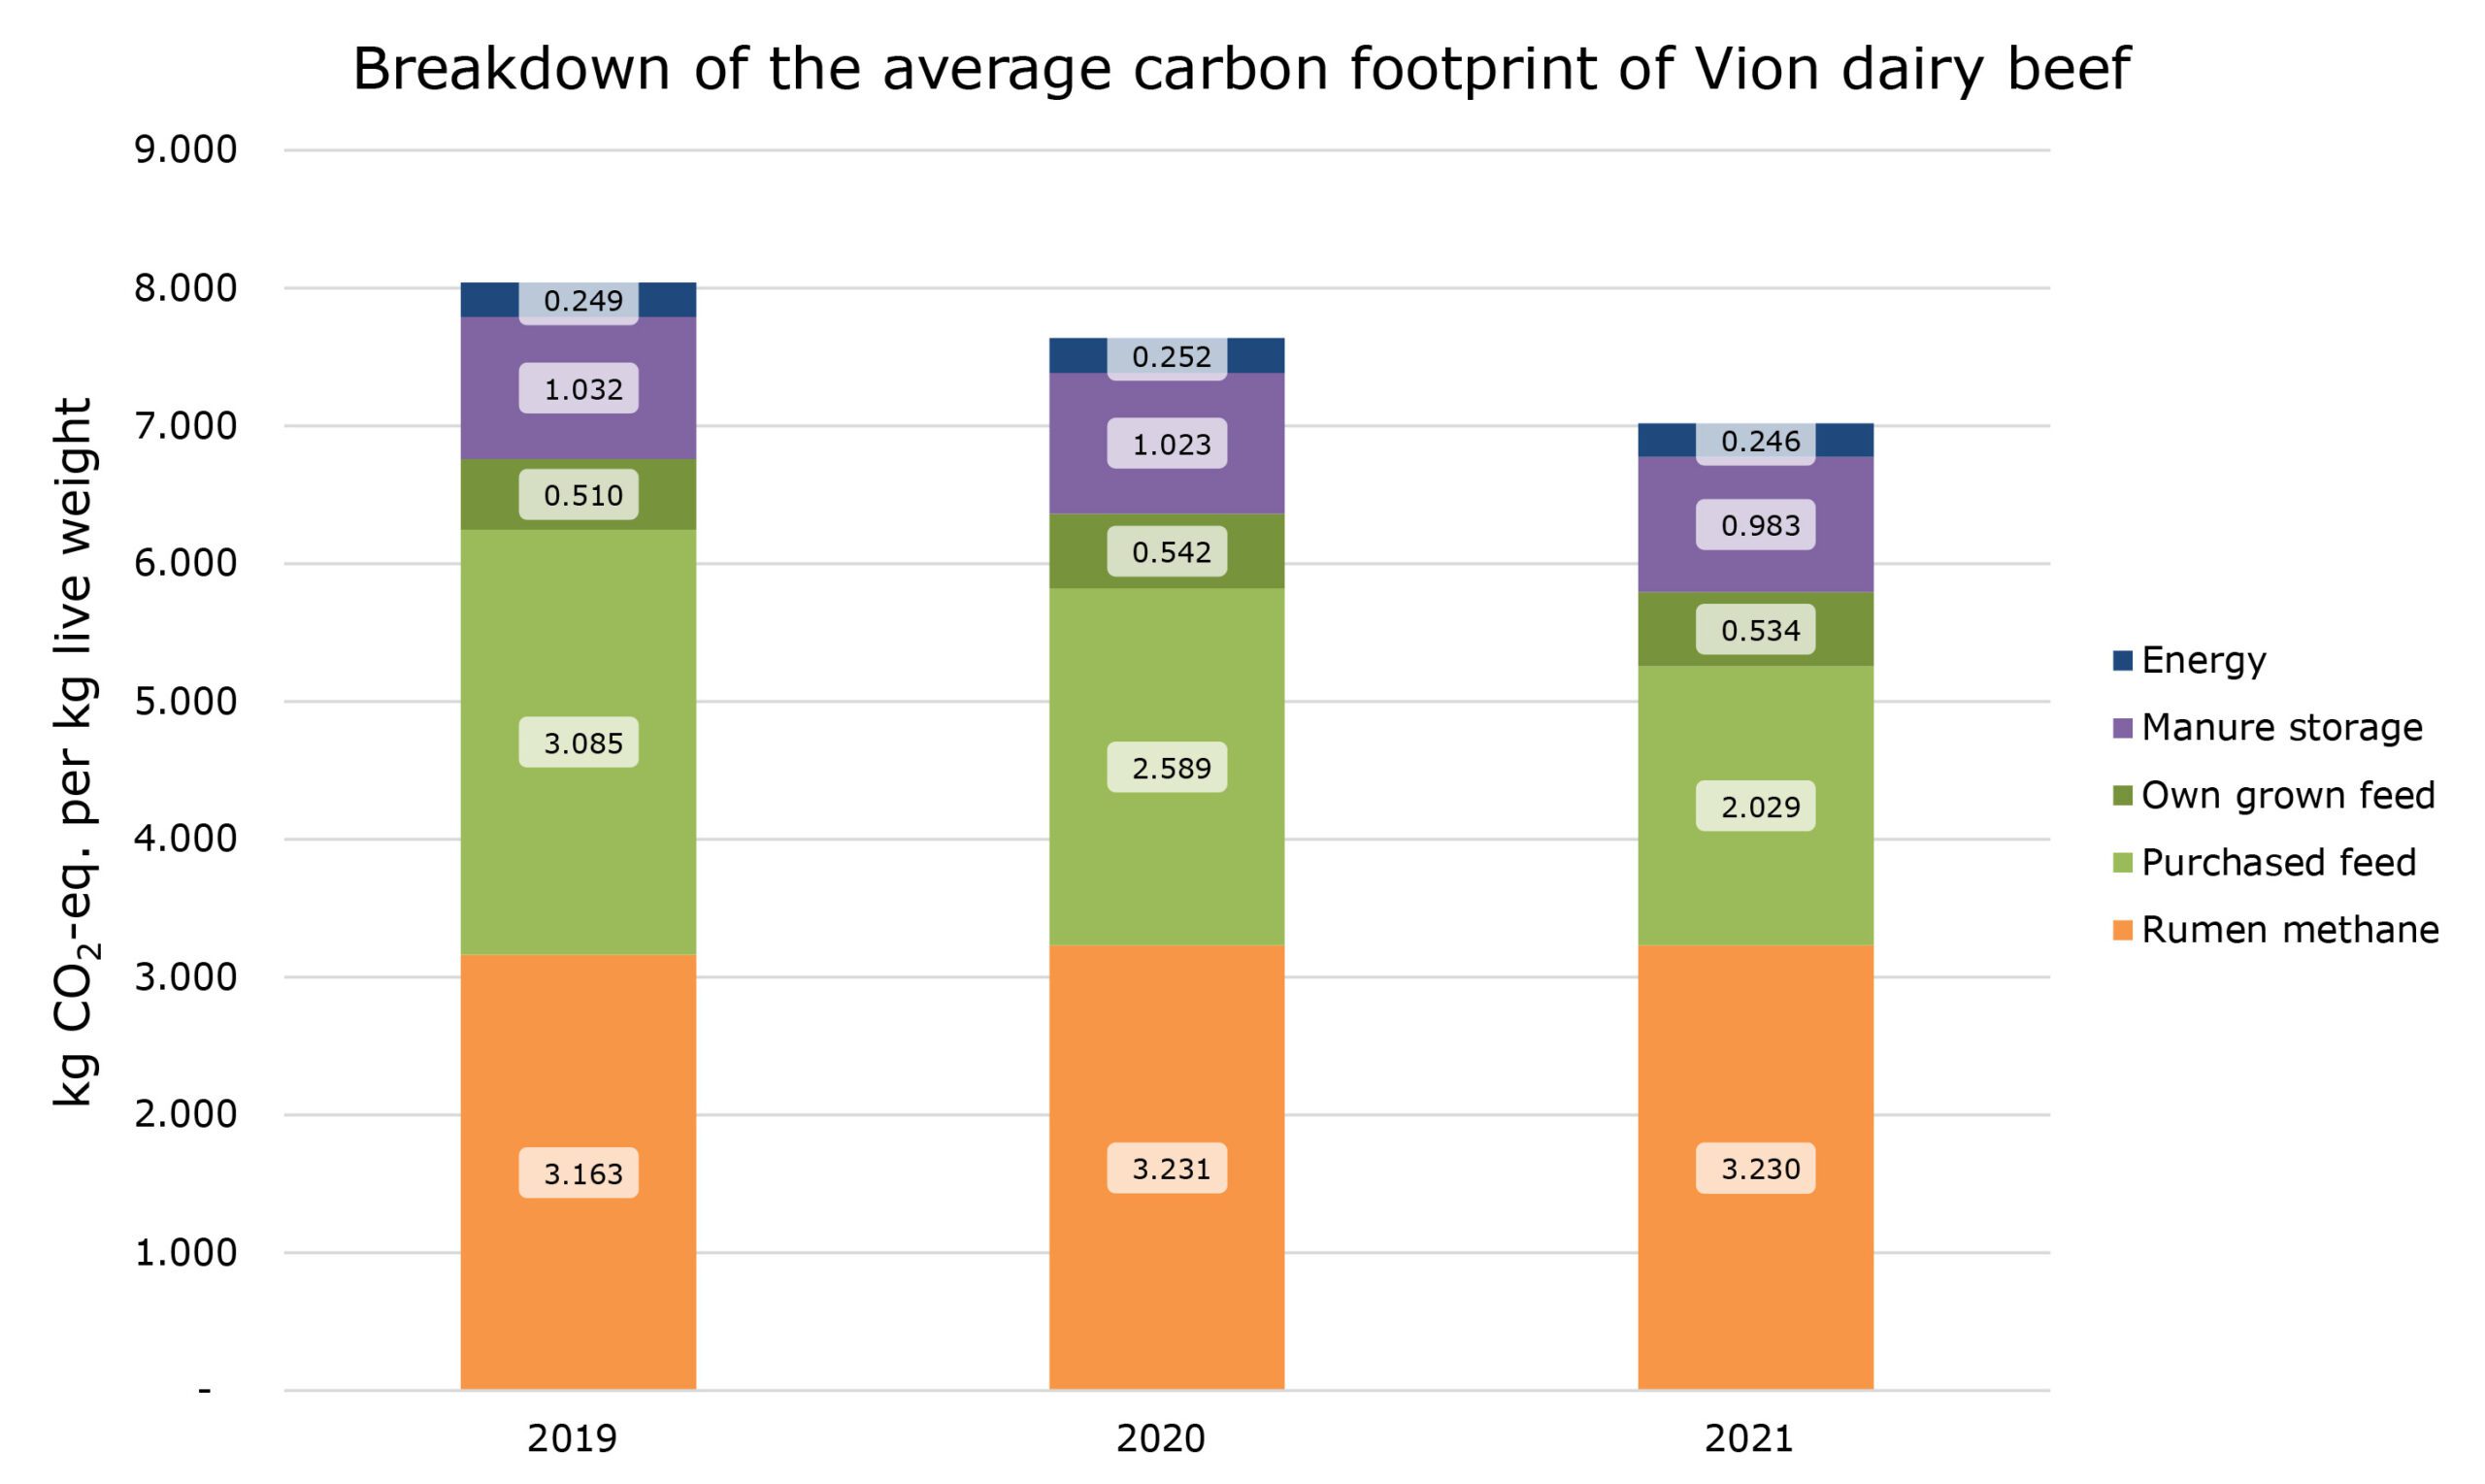
The data allowed for a calculation of the carbon footprint of pork and dairy beef per farmer.
Other Scope 3 categories
Table 2 shows the results for the other Scope 3-categories of the screening and then specifically the items that are not part of the FLAG-components according to SBTi.
| Category | Emissions in 2021 (tCo2e) | Brief category description |
|---|---|---|
| 1. Purchased goods and services | 44,800 | Non-flag purchased goods like pallets, crates, clothing and packaging material. Services like catering, cleaning, laundry, legal and accounting. Excluded are office supplies incl. IT hardware, as these are negligible within the total category of purchased goods and services and have many small suppliers Our biggest scope 3 part are the FLAG related purchased goods: cattle and pigs, covering appr. 85-95% of our total scope 3. We will set targets for these emissions conform the new FLAG guidance asap, but ultimately by Dec 2024. |
| 2. Capital goods | 212,500 | Vehicles, refrigerators and cooling systems, machinery, including spares and parts |
| Fuel and energy related activities | 24,500 | The WTT and T&D losses of the energy used in scope 1 and 2 |
| 4. Upstream transportation & distribution | 1,640,300 | WTW emissions of inboud and outbound transport paid by Vion, the emissions of refrigerants used in transport and distribution, Vion’s share in scope 1 and 2 emissions of cold stores |
| 5. Waste generated in operations | 2,106,800 | All types of waste including wastewater |
| 6. Business travel | 88 | All travels incl. flights booked via our business travel agencies |
| 7. Employee commuting | 17,300 | All employee commuting |
| 8. Upstream leased assets | 260,900 | The energy use of our operational lease cars (because of financial control approach these do not account to scope 1 and 2), our shop-in-shop locations in Nettorama retail stores, and the emissions of a production site we lease |
| 9. Downstream transportation & distribution | 10,300 | The transportation to our tier 1 clients, not paid by Vion |
| 10. Processing of sold products | 475,200 | A part of our meat is processed further by other companies |
| Use of sold products | - | Not applicable as our products (food) are consumed, our products are not appliances to be used |
| 11a. Downstream emissions from fossil fuels distributed but not sold by the company | - | Not applicable |
| 12. End-of-life treatment of sold products | 805,300 | The waste treatment of the packaging we use. Excluded is the packaging used further in the chain as we have no insight into that |
| 13. Downstream leased assets | 1,400 | Energy use in Vion’s houses that are rent to migrant workers |
| 14. Franchises | 160 | The emissions of the De Groene Weg franchisees |
| 15. Investments | 625 | Our equity share % of the scope 1 + 2 emissions of the companies Vion has an equity share in |
Total carbon footprint of Vion
The latest calculation of Vion’s total Scope 1 and 2 emissions over 2021 were 0.12 Mtonne CO2-eq. The average carbon footprint per pig based on data from 550,000 pigs was 0.427 tonne per pig, leading to a total Scope 3 emission of swine for Vion of 6.5 Mtonne CO2-eq. The average carbon footprint per cow based on data from 1,530 cows was 4.564 tonne leading to an estimated total for Vion of 3.8 Mtonne CO2-eq. The total for 2021 for the non-FLAG Scope 3 criteria, resulting from the Scope 3 screening, was 5.6 MTonne CO2-eq. The estimated total carbon footprint of Vion, including the supply chain emissions (both FLAG and non-FLAG criteria), was therewith estimated at 16 MTonne CO2-eq.
